Investment Perspective: 2022 Year-in-Review
For all of us, this past year was extremely challenging to say the least. Off the back of a very strong equity market return in 2021, one key theme that persisted throughout 2022 was uncertainty—uncertainty surrounding the path of inflation surging to levels last seen in the early 1980s, uncertainty surrounding the conflict between Russia and Ukraine, uncertainty surrounding the direction of the global economy recovering from pandemic-related disruptions, and uncertainty surrounding the extent of central bank monetary tightening with the Federal Reserve leading the way.
Amidst all of this uncertainty, 2022 unfolded as the worst calendar-year return for a balanced portfolio since the Global Financial Crisis of 2008-2009. What made this year highly painful from an investment perspective, however, was not just the magnitude of the drawdown, but that both equity and fixed income investments experienced major selloffs together.1 High-quality bonds typically act as a cushion during periods of equity market duress by providing a positive return to offset a decline in stock prices. This was not the case during 2022 and was primarily a result of high and unexpected inflation coupled with the Federal Reserve’s swift series of interest rate increases. Going forward, we expect the relationship between stocks and bonds to normalize with high-quality bonds providing a strong diversification benefit to a portfolio’s equity sleeve. In fact, the vast majority of major stock and bond categories all experienced negative returns last year.
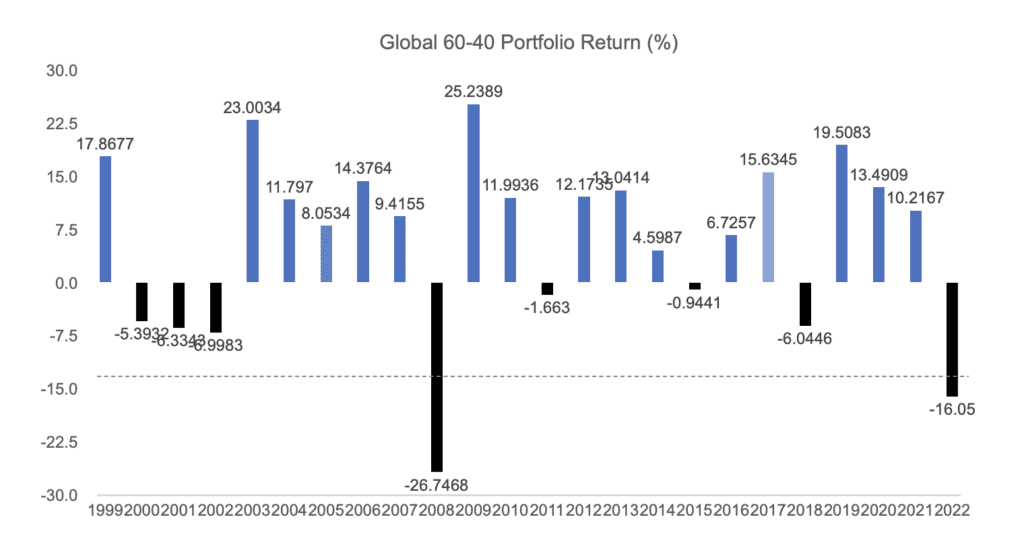
Notes: Data is from Morningstar. The portfolio is comprised of 60% MSCI ACWI Investable Market Index and 40% Bloomberg US Universal Bond Index, rebalanced monthly. The MSCI ACWI IMI measures the performance of the large-, mid- and small-cap segments of developed markets and emerging markets countries’ equity securities. The index covers approximately 99% of the global equity investment opportunity set. The index is market-capitalization weighted. The Bloomberg US Universal Index measures the performance of USD-denominated, taxable bonds that are rated either investment-grade or high-yield.
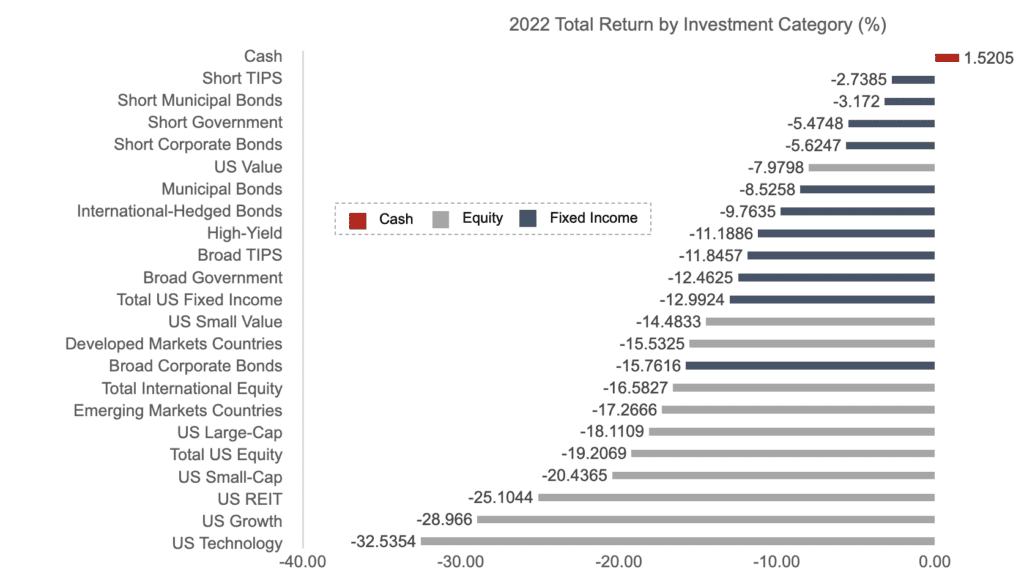
Notes: Data is from Morningstar. Each category is represented by a market index. Refer to the Appendix for a list of the market indexes used in the figure above. The investment categories above generally cover the equity and fixed income universes that PMA invests in. The legend refers to what asset class category each sub-category in the figure belongs to.
The overarching investment climate in 2022 was dominated by high inflation and rising interest rates. For the discussion below, we will center our comments on rising interest rates for brevity, as both variables tend to impact equity and fixed income prices negatively in the short-term. The effect of the Federal Reserve’s aggressive rate hikes can be seen clearly by comparing the current Treasury yield curve to that from one year ago. The US yield curve is inverted at present, meaning shorter-term yields are higher than longer-term yields.2Interest rates across Treasury securities of various maturities form a “term-structure” (yield curve) of interest rates typically ranging from 1 month to 30 years. Typically, the yield curve is upward sloping, reflecting the greater interest rate and inflation risk of longer-maturity bonds compared to shorter-maturity bonds. Though the Federal Reserve can influence interest rates along the yield curve, there are a wide variety of factors that affect such rates. For example, the future outlook for economic growth and inflation are two common variables that impact the longer end of the yield curve more significantly. Historically, an inverted yield curve has been associated with a recession about 12 months into future.
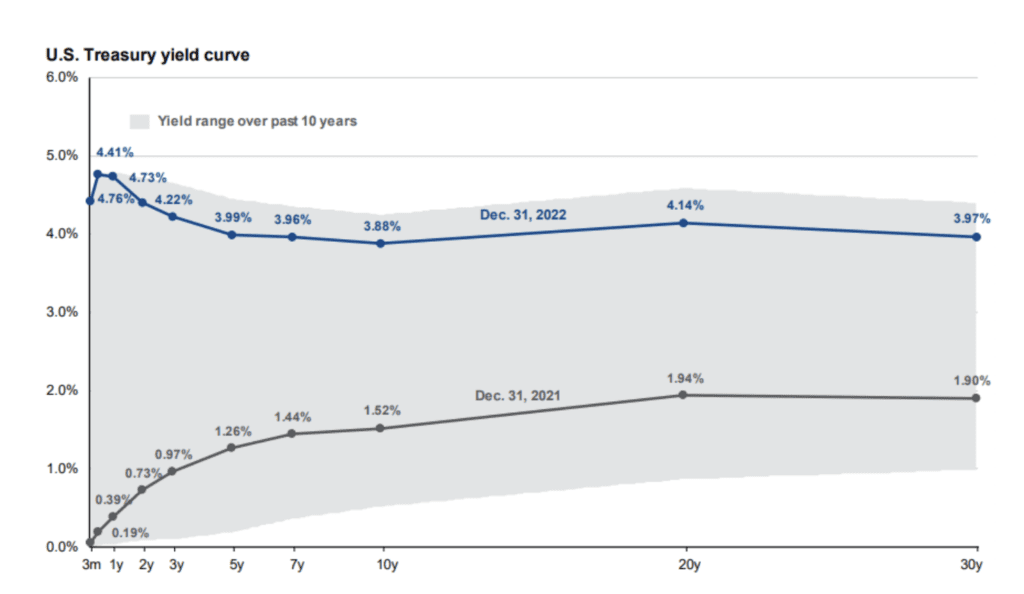
Notes: The figure above was taken from the J.P. Morgan Guide to the Markets®. 4Q 2022.
Source: FactSet, Federal Reserve, J.P. Morgan Asset Management. Guide to the Markets – U.S. Data are as of December 31, 2022.
Fixed income instruments are affected directly by rising rates as higher prevailing interest rates make bonds issued previously with lower coupon rates less attractive to investors. The most important fixed income trend of note in 2022 was that shorter-maturity bonds outperformed longer-maturity bonds—as less rate-sensitive investments, shorter-maturity bonds experienced a better (less negative) return, and in some cases, by a significant margin. For example, short corporate bonds outperformed the broad corporate bond market, which has a longer average maturity, by about 10% in 2022. Treasury Inflation-Protected Securities (TIPS) also fared relatively well throughout 2022, declining by less than nominal government bond counterparts of a similar maturity due in large part to the inflation adjustment built into their structure.
Equities are also generally affected by rising interest rates, though the relationship is more complicated. Generally speaking, rising rates suggest future cash flows (e.g., dividend payments) become less valuable when discounted back to the present and valuations (i.e., price-to-earnings ratio) tend to compress. It is important to note that stock prices are affected by a wide variety of factors, most of which are highly unpredictable in advance. This unpredictability makes market timing virtually impossible to execute consistently through time.
Across the equity universe, some market sectors tend to be more interest rate sensitive than others, and we saw this borne out throughout 2022. For example, after a very strong stretch of performance dating back to 2009, US technology and growth stocks significantly underperformed the broad market, with some of the large, mega-cap stocks known familiarly by the acronym “FAANG” (Facebook, Apple, Amazon, Netflix, Google) experiencing returns below -50%. REITs (real estate investment trusts) also experienced notable underperformance relative to the broad US market. Value stocks, on the other hand, outperformed the broad US market by a fairly comfortable margin and were broadly 2022’s best performing equity category.
From PMA’s perspective, we took a number of important actions leading up to 2022 and throughout the year in our clients’ portfolios.3 The various changes described below are general adjustments made to PMA’s model portfolios. Changes may not have been reflected in every managed account due to client-specific circumstances or other factors. Though many of our clients’ returns last year were negative on an absolute basis, providing downside protection during poor market environments (in other words, a less negative return) is an important goal for our firm, and the adjustments that our Investment Committee approved were made with this principle in mind.
At the asset allocation level, we kept our equity allocations steady with the longer-term in focus. Over longer horizons, a broad-based equity allocation has historically delivered an inflation hedge by providing a positive real return (or a return that exceeds the rate of inflation). We also modestly boosted our portfolios’ value orientation, maintained an underweight to some of the mega-cap technology stocks (held via our mutual funds), and reduced our international equity exposure. In our fixed income sleeves, we added material allocations to inflation-protected bonds and kept the maturity profile short to reduce the impact of high inflation and rising rates on our portfolios.
Ultimately, with 2022 now in the rear-view mirror, it is easier for us to strike a more optimistic tone. Even though much of the uncertainty referenced above is still present, and as painful as this last year was to live through from an investment perspective, in our opinion, the future is now brighter for the markets. Materially higher bond yields now suggest stronger future fixed income returns than we’ve experienced over the last decade. And as a result of last year’s stock market selloff, valuations now look far more reasonable for US equities in particular. Though we may certainly see more downward pressure in the markets before conditions improve, we are decidedly more optimistic about expected returns for our model portfolios over the next 1-3 years in 2023 and beyond.
We wish you a happy and healthy new year, and hopefully one markedly improved by a receding pandemic. If you are interested in discussing your specific returns in greater detail, please do not hesitate to reach out to your advisor.
Appendix
The following market indexes are used in the “2022 total return by investment category” figure. All index data is from Morningstar. NASDAQ Composite Index, Russell 3000 Growth Index, FTSE NAREIT All REITs Index, MSCI EAFE IMI, MSCI ACWI Ex-USA IMI, Russell 2000 Index, Russell 3000 Index, S&P 500 Index, FTSE All Emerging Index, Russell 2000 Value Index, Bloomberg US Corporate Bond Index, Russell 3000 Value Index, Bloomberg US Universal Bond Index, Bloomberg High Yield Corporate Bond Index, Bloomberg US Treasury US TIPS Bond Index, Bloomberg US Treasury Bond Index, Bloomberg Municipal Bond Index, Bloomberg Global Aggregate Ex-USD Hedged Bond Index, Bloomberg Corporate Bond 1-5 Year Index, Bloomberg Treasury Bond 1-5 Year Index, Bloomberg Municipal Bond 1-5 Year Index, Bloomberg US TIPS Bond 0-5 Year Index, Bloomberg US Treasury Bill 1-3 Month Index.