Phillies Winning Means Markets Losing?
“Far more money has been lost by investors preparing for corrections or trying to anticipate corrections than has been lost in corrections themselves.”
—Peter Lynch
I have found it entertaining to recently see a number of articles in financial publications such as the Wall Street Journal, Bloomberg and Forbes suggesting that the Philadelphia Phillies winning the World Series is a leading indicator of a coming recession or market correction. Most of the articles sound similar to this from the Wall Street Journal:
When Philadelphia baseball teams do well, in a pattern that has held for a century, financial markets tend to strike out. It started with the old Philadelphia Athletics (before they left town). Their 1929 championship preceded the stock crash and Great Depression. In 1980, the Phillies won their first World Series, and a recession raged right through 1983, when the team again got to the final round and lost. The Phils won the World Series a second time in 2008, and boom: a home-run financial crisis. Now, the scrappy Phils will be back on the big stage against the favored Houston Astros, and it is as if this struggling economy already knew it was going to be in trouble.
While I know it would insult the intelligence of the regular readers of this letter to spend any time explaining why the “Phillies Indicator” is a silly concept, it’s not a whole lot sillier than the many popular market indicators and professional predictors that are constantly offering opinions as to where the financial markets and the asset classes that make-up the financial markets are headed.
Columnist Mark Hulbert cites, in a recent article in MarketWatch, a study titled “How Accurate are Capital Market Assumptions, and How Should We Use Them?” conducted by Mike Sebastian, the former chief investment officer at Aon. “Sebastian reached his conclusion by compiling the projected asset class returns from 17 Wall Street firms in 2012, and then comparing those projections to what actually happened over the subsequent decade.” The results are summarized in the accompanying chart, below.
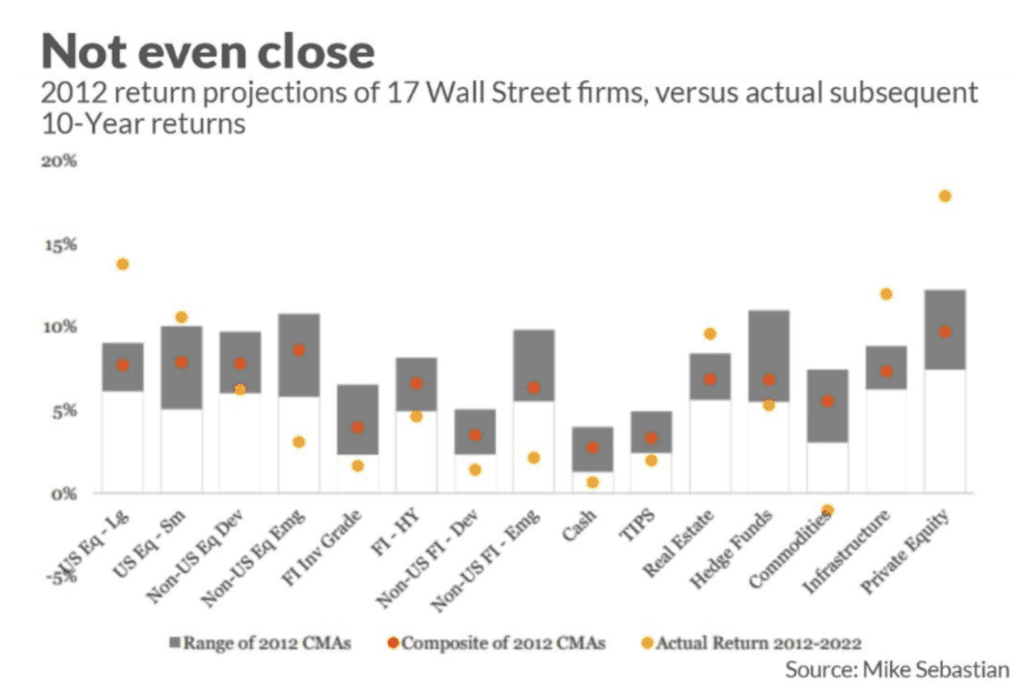
Hulbert states: “Notice that for 14 of the 15 asset classes Sebastian analyzed, the class’ actual 10-year return was outside the minimum-maximum range of the firms in his sample. In other words, the asset class either produced a return that exceeded even the most optimistic firm’s 2012 projection, or was worse than that of the most pessimistic firm.” As the chart states, the projections of 17 top Wall Street firms were “not even close.”
Market “experts”, not unlike the writers of articles about subjects such as the “Phillies Indicator”, need to get people to consume what they publish and often the best way to get people to notice their respective opinions is to write about something that is controversial or will garner attention. In the internet age, it is often called “clickbait.” And, I’m a perfect example of why this works. Not only did I click on and read the articles about the “Phillies Indicator”, I am now writing about them in this month’s Partner Talk!
As silly as this all may seem, the point I am trying mightily to get to is the same one that Mr. Sebastian reached in his above cited study: “One worthwhile approach he thinks would be appropriate would be to rarely deviate from your default asset allocation (your target weights for each of the asset classes) and not deviate very much when you do.”
This is what we have been preaching at PMA since the firm’s founding forty years ago. The short-term future direction of markets and asset classes cannot be predicted, and it is futile to try. Therefore, we don’t waste time trying. Instead we focus on what we can control, the risk in our clients’ portfolios. We stick to the respective asset allocation (risk) models that each of our clients has chosen and make minor changes based on fluctuations in risk in the markets that we can measure.
The below chart summarizes asset class returns ranked from highest to lowest from 2007 through September 30th of 2022. Notably, the returns for various asset classes are random and highly volatile with one year’s top performer often being one of the next year’s worst. There is simply no way to predict which asset classes will do best or worst in the future. However, what is noticeable is that a “balanced portfolio” (labeled “Asset Allocation” in the chart) stays mostly in the middle of the chart and is less volatile on an annualized basis over the entire period from 2007-2021.
While this Asset Allocation portfolio has some differences from PMA’s balanced portfolios, the larger concept of owning a diversified portfolio that includes many asset classes, over time, leads to a much less risky portfolio that still achieves very respectable returns, still applies.
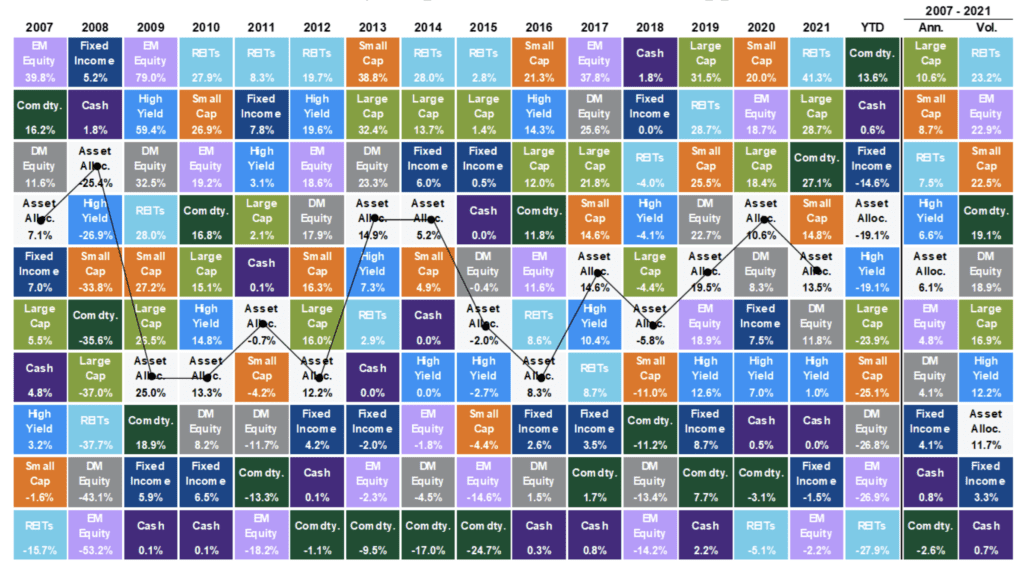
Source: J.P. Morgan Guide to the Markets®.
As I wrote in an earlier Partner Talk this year, PMA clients should stick to the financial and investment plans we have developed together and do their best to ignore all the distractions along the way. Ignore, or at least just use for entertainment purposes, the clickbait articles and popular media programs offering financial prognostications that are everywhere. Don’t make rash, emotional decisions to change course when things get dicey. Doing so has the tendency to destroy value permanently. We appreciate your continued trust in our stewardship of your assets.
And, although it will be over by the time you read this, I’ll still say — Go Phillies!