Equanimity and Equities
On April 28, 2023, the S&P 500 closed at 4,169. A year earlier, on April 29, 2022 it closed at 4,132. And, a year before that, on April 30, 2021, it closed at 4,181. During this 730-day period the 500 largest and most successful companies in the richest country in the world have returned essentially zero.
Here’s a graph that illustrates these past two years:
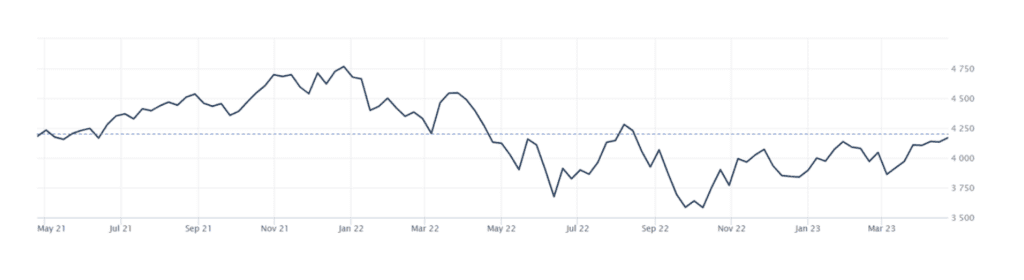
Performance of the S&P 500: April 29, 2022 through April 28, 2023
Source: The Wall Street Journal
Financial advisors, ourselves included, drum home the idea that long-term returns are the only returns that matter. This is generally good advice, but a thoughtful investor might appropriately respond: what, precisely, is the short-term and what is the long-term? And a thoughtful investor who lived through the past two years might even more appropriately respond: call the last two years whatever you want, I’m calling them painful.
The truth is there is no precise definition of the short-term and the long-term. One standard definition from tax law is that the short-term refers to an investment of one-year or less. For example, if you buy a fund and then sell it before one year goes by you are subject to the higher short-term capital gains rate. Another definition, often used in relation to bonds, is that the short-term refers to bonds with a maturity of three years or less.
But what about as it relates to human beings? There, the definition becomes even more fuzzy. After all, one’s person short-term may be another person’s long-term, and vice versa. Did you weather these past two years with relative equanimity, or did you sweat with anxiety? That depends on your temperament and also what stage of life you are in. Either way, an advisor who would blithely dismiss the last two years as being not worthy of a client’s concern is an advisor with a tin-ear.
In an early edition of his classic book “Stocks for the Long Run”, Jeremy Siegel of the Wharton School extols the benefits of long-term investing. His discussion of long-term returns suggests that his definition of long-term is truly a long-term period of time, covering periods ranging from 70 to 195 years. However, he acknowledges that over some not insignificant periods stocks can be disappointing. And, as evidence, he cites the period from 1968 through 1981, when the real rate of return on stocks was -0.4%.
I was fortunately too young to follow the financial markets from 1968 through 1981. But for those who do have personal memories, calling a fourteen-year period the “short-term” is questionable. We live in the short-term, and sometimes the short-term is not really that short.
Unfortunately, these difficult periods are not as unusual as we would like. Most people reading this cover letter lived through one themselves, during the years 2000 through 2009, a decade bookended by the tech bubble debacle of 2000 – 2002 and the Great Financial Crisis of 2008. Here is a similar chart of the S&P 500 that illustrates what those ten years were like:
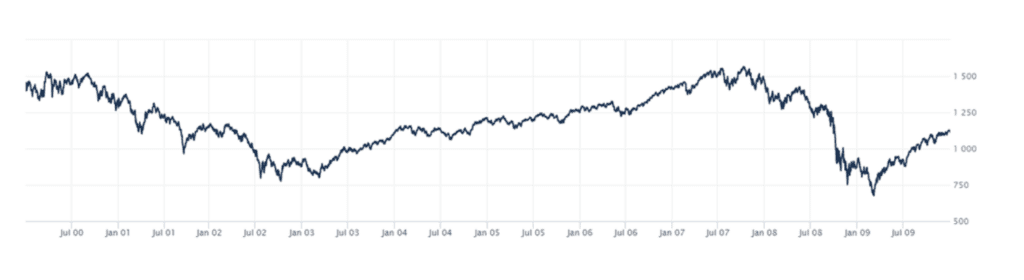
Performance of the S&P 500: January 1, 2000 through December 31, 2009
Source: The Wall Street Journal
The S&P 500’s average return per year during this period was -0.95% (including dividends), meaning an investor in an S&P 500 fund on average lost almost 1% per year over an entire decade. What can we do during periods like this, which unfortunately are the price we have to pay to enjoy the truly superior long-term returns of stocks?
One, we can try to temper our expectations by looking at history. Periods of “side-ways” stock movement are not that unusual. The table below tells us how often stocks outperformed bonds during the period from 1926 through 2020. If this chart is any guide to the future, there is almost a 20% chance that an investor will live through a decade in which long-term bonds outperform the S&P 500.

Source: A Wealth of Common Sense
Two, we need to remind ourselves that the S&P 500 is not even close to the entire universe of financial assets. Diversifying has paid off during these difficult periods. Here, for example, is the same chart over the same period (2000 – 2009) with the addition of the Russell 2000 Index, an index of small cap stocks, which returned about 3.5% per year.
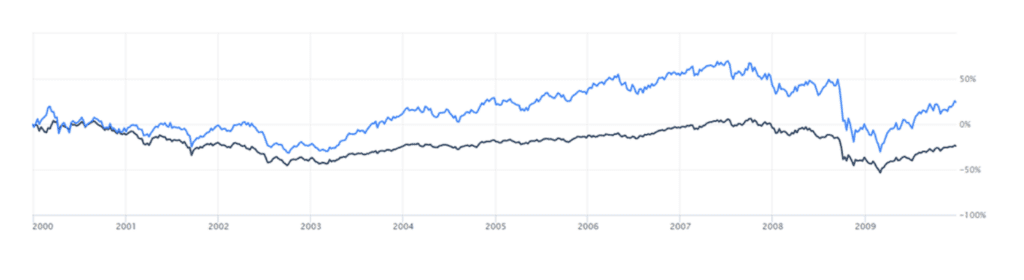
Source: The Wall Street Journal
And here is the same chart if you added some exposure to small-cap value stocks, which during this same time period returned about 8% per year.
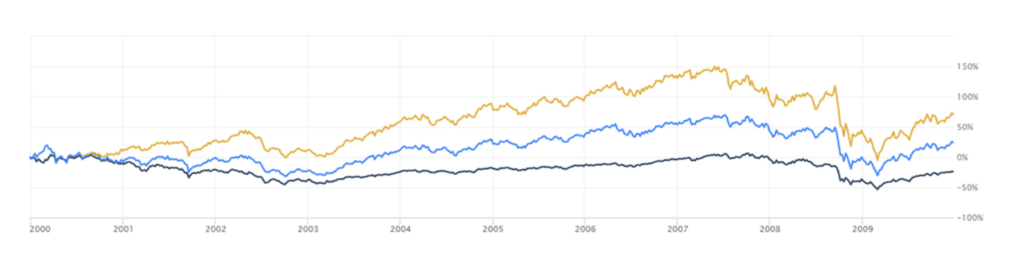
Source: The Wall Street Journal
So, by diversifying across different sectors of the total stock market, an investor during 2000 through 2009 was able to diversify away some of the risk of large-cap US equities in the S&P 500 Index. And if they also had an allocation to fixed income, they benefited from an asset class whose diversification benefits during that decade included being uncorrelated to stocks while also delivering a positive return.
Unfortunately, stocks can go sideways more often than we would like, and for longer periods of time than we might realize. This is one of the attributes that makes them one of the riskiest asset classes in which to invest. And it is why holding them rewards the patient investor. Their returns – like their losses – can come in bursts that are impossible to time. And this is why, unless you are very young or have a very high risk tolerance, holding a portfolio of 100% stocks is probably not in your best interest. Finding what is the right sweet spot for you – that percentage allocation to stocks that falls somewhere between 0% and 100% – is not a science, but a product of temperament and circumstances. It’s a process of trial and error, of conversations with your advisor, and of changes in your life circumstances.